

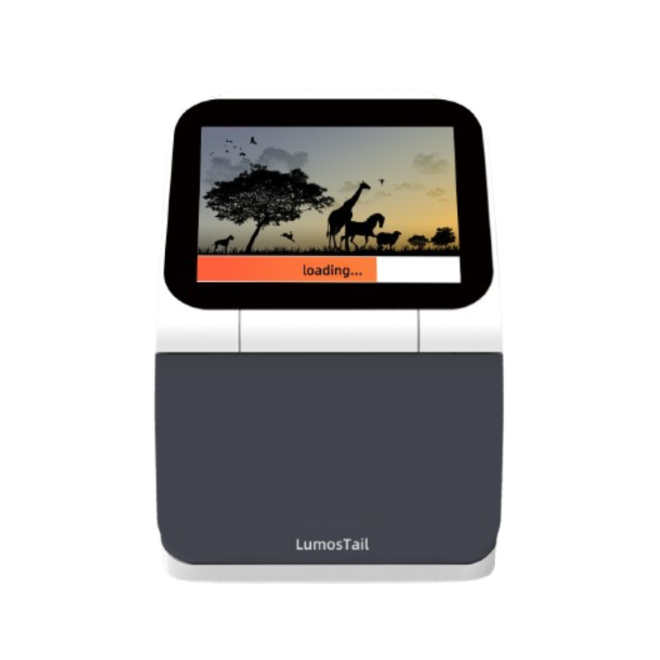
Staring at tangled IFQA manuals again, wondering if the “working principle” is secret code for “good luck, you’re on your own”? Relax—your samples are confused too, they just can’t file complaints.
Focus on how fluorescent antibodies bind targets, then how the analyzer converts light signals into numbers; pair this with clear QC steps and IF guidelines like the WHO’s immunoassay standards in this report to finally tame the workflow.
⭐ Basic Structure of an Immunofluorescence Quantitative Analyzer
An immunofluorescence quantitative analyzer integrates optics, mechanics, and software to measure fluorescent signals from test cards and convert them into accurate numerical results.
The instrument supports rapid testing, needs little sample volume, and closely matches the workflow of Fluorescent Immunochromatography systems used in clinical and veterinary diagnostics.
1. Sample Loading and Test Card Module
The analyzer accepts single-use test cards or cassettes. Users insert the card into a guided slot, which ensures correct orientation and stable positioning during the reading process.
- Pre-coated reaction membrane
- Barcode or QR code for test ID
- Mechanical guides to avoid misplacement
2. Optical Excitation and Emission Path
The analyzer uses LEDs or laser diodes to excite fluorescent labels and collects emitted light through lenses and filters to reduce interference and background noise.
| Component | Function |
|---|---|
| Excitation source | Provides stable light |
| Optical filter | Blocks stray wavelengths |
| Lens system | Focuses light on test line |
3. Signal Detection and Electronic Circuitry
Photodetectors transform the fluorescent signal into electrical current. Amplifiers and analog-to-digital converters then digitize this signal for software processing.
- Photodiode or CCD/CMOS sensor
- Low-noise amplifier
- High-resolution ADC module
4. Embedded Processor and User Interface
An internal processor runs algorithms, stores calibration data, and displays results on a touch screen or external computer, supporting fast and clear clinical decisions.
| Element | Role |
|---|---|
| CPU/MCU | Controls all operations |
| Display | Shows numeric results |
| Ports | Enable data export |
🔬 Fluorescent Labeling and Antigen–Antibody Reaction Mechanism
The analyzer relies on fluorescently labeled antibodies that bind to target antigens in the sample. Their binding forms complexes that stay on specific lines of the test strip.
When the instrument excites these labels, the emitted light intensity reflects the amount of antigen, allowing quantitative measurement over a defined concentration range.
1. Principles of Fluorescent Labeling
Manufacturers attach fluorescent molecules to antibodies at controlled ratios. This design keeps antibody activity stable while providing strong and reproducible fluorescence signals.
- Stable dyes with narrow spectra
- Low photobleaching rate
- High quantum yield for bright signals
2. Antigen–Antibody Binding on the Test Strip
During testing, the sample flows along the membrane by capillary force. Antigens bind to labeled antibodies and then to capture antibodies at the test and control lines.
| Region | Content |
|---|---|
| Sample pad | Receives specimen |
| Conjugate pad | Holds labeled antibodies |
| Test line | Captures target complex |
| Control line | Confirms valid flow |
3. Factors Influencing Binding Efficiency
Binding efficiency depends on reaction time, temperature, buffer composition, and sample quality. Proper operating steps ensure stable and reproducible fluorescence intensity.
- Follow recommended incubation time
- Avoid hemolyzed or clotted samples
- Use correct buffer volume
4. Data Distribution of Typical Biomarkers
Analyzers often track biomarker concentrations across normal and disease groups. Visualizing these differences guides clinical cutoffs and improves diagnostic accuracy.
💡 Optical Signal Capture and Photodetector Conversion Process
The analyzer collects the emitted fluorescence with a fine-tuned optical system, then converts it into digital signals using sensitive photodetectors and stable electronics.
1. Excitation Timing and Light Control
The instrument activates the excitation source only when the test card is in place. Controlled timing reduces background and extends LED or laser life.
- Automatic card detection
- Short exposure windows
- Optimized light intensity
2. Photodetector Response and Line Scanning
The detector scans across test and control lines. It records fluorescence intensity at each point to build a detailed signal profile along the strip.
| Parameter | Impact |
|---|---|
| Integration time | Controls sensitivity |
| Gain setting | Adjusts signal range |
| Sampling rate | Affects scan speed |
3. Noise Reduction and Baseline Correction
Signal-processing circuits remove background noise from ambient light, electronics, and the membrane itself. The system then defines a stable baseline for accurate reading.
- Dark current subtraction
- Optical shielding design
- Digital smoothing filters
📊 Algorithmic Quantification, Calibration Curves, and Result Interpretation
The analyzer’s software converts fluorescence intensity into concentration values using preset calibration curves and built-in quality checks for reliable clinical interpretation.
1. Building and Storing Calibration Curves
Calibration uses known standards measured during manufacturing. The system fits these points to a curve model and stores parameters for each test item.
| Curve Type | Use Case |
|---|---|
| Linear | Narrow, simple ranges |
| Logit-log | Immunoassay data |
| 4-PL / 5-PL | Wide dynamic ranges |
2. Converting Signal to Concentration
During a test, the software compares measured intensity to the stored curve. It interpolates the corresponding concentration and applies unit conversions if needed.
- Checks signal within range
- Uses curve equation
- Rounds values for display
3. Flags, Reference Ranges, and Reports
The analyzer marks results as low, normal, or high relative to reference ranges. It can print or export structured reports for laboratory information systems.
- Custom reference intervals
- Automatic abnormal flags
- Traceable test records
🧪 Application Scenarios and Advantages of LumosTail Immunofluorescence Analyzers
LumosTail immunofluorescence analyzers support fast, quantitative testing in clinics, laboratories, and veterinary settings, providing reliable results with easy operation and minimal maintenance.
1. Clinical and Point-of-Care Testing
LumosTail systems measure markers such as CRP, PCT, cTnI, and D-dimer near patients. This helps clinicians make quick triage and treatment decisions.
| Setting | Benefit |
|---|---|
| Emergency room | Rapid risk assessment |
| Outpatient clinic | Same-visit results |
| Rural hospital | Lab-quality testing |
2. Veterinary and Specialized Diagnostics
In animal health, LumosTail analyzers handle small sample volumes and deliver species-specific panels, supporting fast decisions in clinics and field environments.
- Small-animal practices
- Livestock disease control
- On-site screening campaigns
3. Key Advantages Over Traditional Methods
Compared with manual immunoassays, LumosTail instruments provide automated reading, objective results, and strong precision across a wide linear range, with compact size and user-friendly software.
- Higher sensitivity and accuracy
- Short turnaround time
- Reduced operator variability
Conclusion
Immunofluorescence quantitative analyzers combine precise optics, sensitive detection, and robust algorithms to transform fluorescent signals into trustworthy numbers. They support rapid, evidence-based decisions in many medical and veterinary settings.
Understanding their working principle helps users operate the system correctly, judge results with confidence, and choose analyzers that match their testing needs and workflow.
Frequently Asked Questions about immunofluorescence quantitative analyzer
1. What is an immunofluorescence quantitative analyzer?
It is a diagnostic instrument that reads fluorescent signals from immunoassay test cards and converts them into numerical concentrations of specific biomarkers in a sample.
2. Which samples can it test?
Most systems support whole blood, serum, plasma, or urine, depending on the assay card. Always follow the reagent instructions for the correct sample type.
3. How long does a typical test take?
Most assays finish within 3–15 minutes from sample loading to result display, making the analyzer suitable for urgent and point-of-care testing.
4. How is accuracy ensured?
Accuracy relies on factory calibration, internal quality controls, and proper operation. Many analyzers also support external quality-control materials and automatic self-check routines.
5. Do operators need advanced training?
Basic training is enough for daily use because the workflow is guided and automated. However, supervisors should understand calibration, maintenance, and quality-control procedures.